Built for Sparx Systems Community
With Power BI Reports With Power BI Canvas With Power BI Visuals
Enable CXOs and business leaders to unlock insights, and drive growth with Power BI Dashboards.
Power BI Connector
Why Teams Need to Bring Sparx EA into Power BI
Empower faster decisions with real-time Sparx Systems EA data,
tailored KPIs, and clear process views.
Decision-Making
Empowers teams with insights, accelerating execution speed and decision-making.
Flexible Insights
Tailor reports to business needs – track KPI’s, progress, and boost efficiency.
Real-Time Reporting
Delivers real-time insights with live data for faster, and informed decisions.

About Power BI for Sparx Systems EA
Architecture data is only valuable when it informs decisions. With the Power BI integration for Sparx Systems Enterprise Architect, your models connect seamlessly to Power BI, turning complex information into business-friendly visuals.
Predefined Templates
Import Templates, Gain Insights Instantly
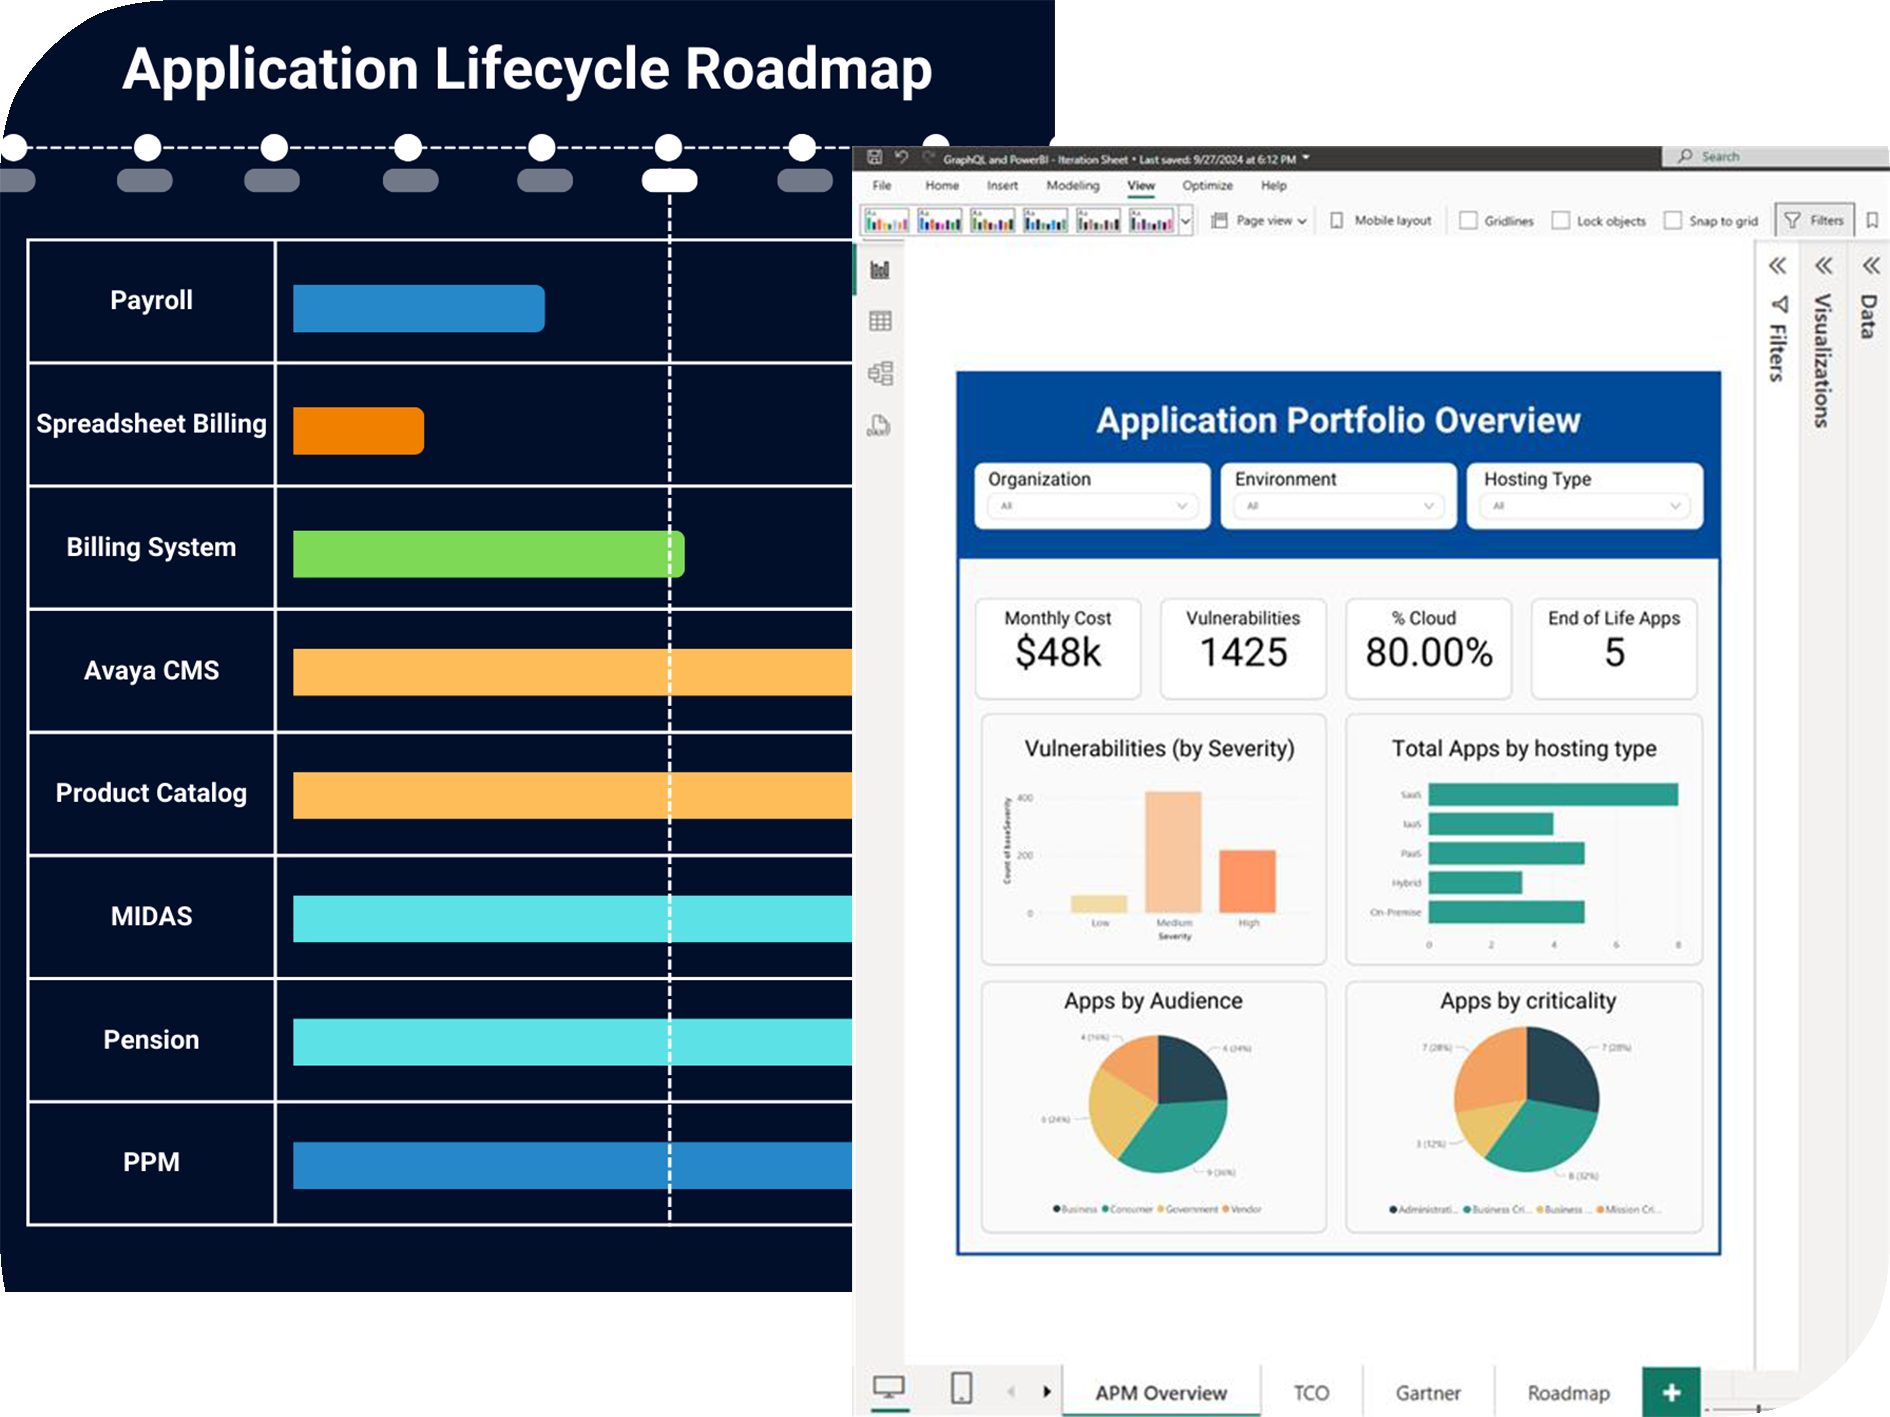
With ready-to-import dashboards, simplify architecture use cases like Application Portfolio Management – connect models, and insights are ready instantly.


Divers Choices
Leverage Power BI’s charts for faster insights
Sparx Systems users can effectively leverage Power BI’s built-in rich chart options to build, modify, and adapt detailed reports instantly, driving smarter insights and better decisions.
How It Works
From Source to Insights
Turn Sparx Systems EA data into decision-ready Power BI dashboards with a simple four-step flow.
Step 1
Connect Source
Effortlessly link your Sparx Systems model data to Power BI for real-time insights.
Step 2
Transform Data
Convert Sparx EA’s physical model into logical, business-ready data structures.
Step 3
Design Dashboard
Design tailored dashboards using Power BI’s rich visuals to showcase key insights.
Step 4
Share Insights
Share interactive reports with stakeholders, ensuring clarity and informed decisions.
