Transform Sparx Systems EA Data into PowerBI Reports Using EA GraphLink
Overview
This document serves as a comprehensive guide to leveraging the EA GraphLink connector to publish model information from Sparx Systems Enterprise Architect (EA) into Microsoft PowerBI. EA GraphLink is a purpose-built connector designed to empower the Sparx Systems community by transforming data captured in EA into dynamic, insightful reports within the PowerBI platform.
The EA GraphLink connector addresses the needs of PowerBI users seeking seamless integration with the Sparx Systems architecture repository to process and analyse EA data. By introducing this connector, users gain direct access to EA data, streamlining its management, processing, and visualisation within PowerBI. This eliminates the complexity of establishing inefficient data connections between Sparx Systems Enterprise Architect and PowerBI, enhancing efficiency and enabling more effective data visualisation.
Prerequisites
Before installing EA GraphLink in Power BI, ensure the following:
- The EA model must be connected to EA GraphLink. (Refer EA GraphLink PDF)
- Power BI Desktop must be installed on your machine.
- User must have EA GraphLink admin account credentials to establish a connection.
Installing the EA GraphLink Connector App in Microsoft Power BI
The EA GraphLink Connector App is typically available through the Power BI Apps Marketplace. However, Microsoft allows the application to be published in the second quarter; in the meantime, the manual installation process can be followed for installing the EA GraphLink.
Manual Installation Steps
To install the EA GraphLink Connector App, follow these steps:
Create Required Directories and Place the Connector App
- Open Power BI Desktop.
- Navigate to the “Documents Folder” from Windows File Explorer and create a folder named Power BI Desktop (if not already present).
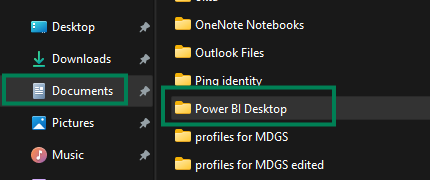
- Within this folder, create another subfolder named Custom Connectors.
- Copy the provided EA GraphLink Connector App file name, which is EAGraphLink.mez (. mez extension).
- Paste it into the following path:
- Documents > Power BI Desktop > Custom Connectors.

Enabling Access to the EA GraphLink Connector App
By default, Power BI Desktop restricts access to external connector apps. To enable the EA GraphLink Connector App, follow these steps:
Step I: Open Security Settings
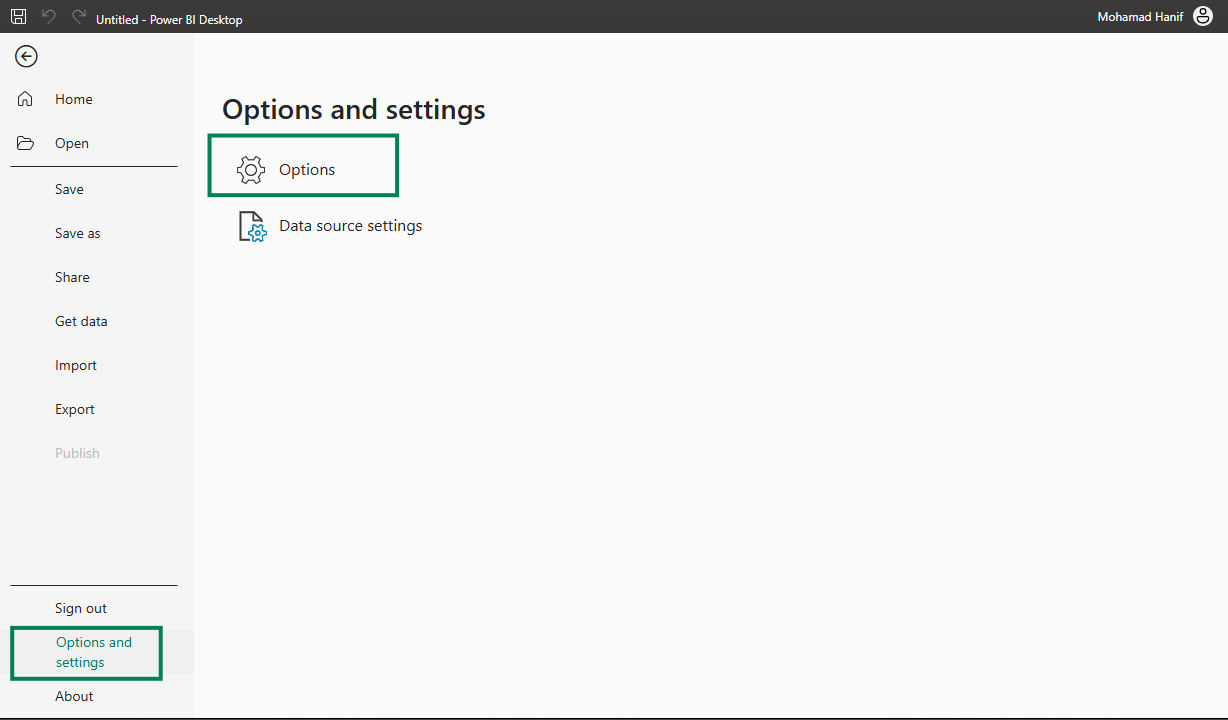
Navigate to File > Options and Settings > Options > Security.
Note: Modifying these settings may require system administrator privileges. If access is restricted, contact the IT administrator or launch Power BI Desktop as an administrator.
Step II: Modify Data Extension Settings
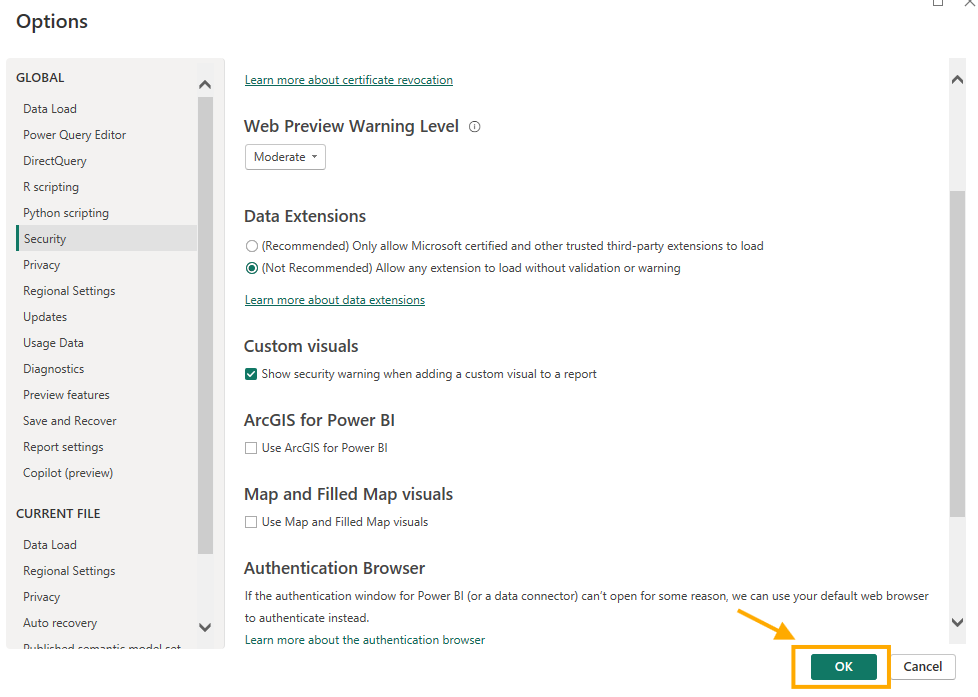
- Under Data Extensions, select “(Not Recommended) Allow any extension to load without validation or warning”.

- Click OK to save the settings.
- Restart Power BI Desktop to apply the changes.
This configuration allows EA GraphLink to function within Power BI Desktop.
Loading Data into Power BI Using EA GraphLink
Learn how to connect Power BI to EA GraphLink, retrieve data using the connector, and enable seamless integration for reporting and analysis.
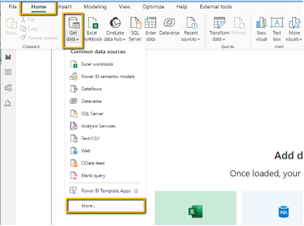
Step I: Access the “Get Data” Menu
- Click on Get Data from the Home tab.
- Select More to view additional data sources.
Step II: Locate the EA GraphLink Connector App
- Enter EA GraphLink in the search bar.
- The connector app will appear in the results, as shown in the image below.
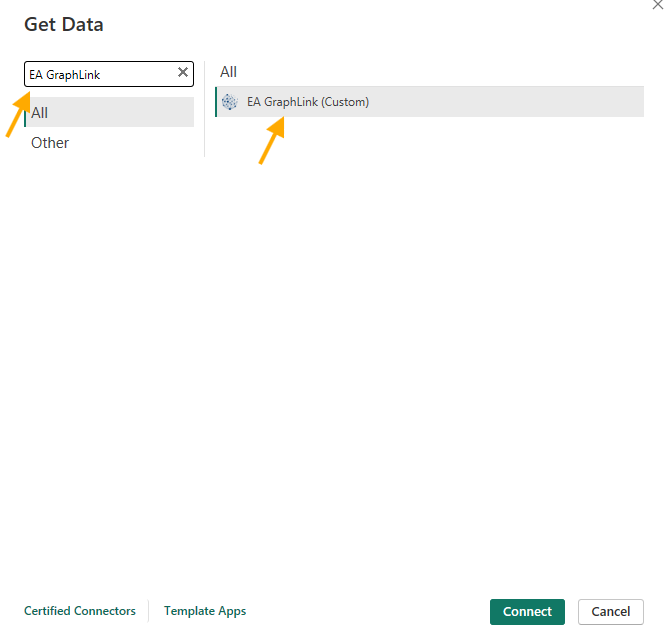
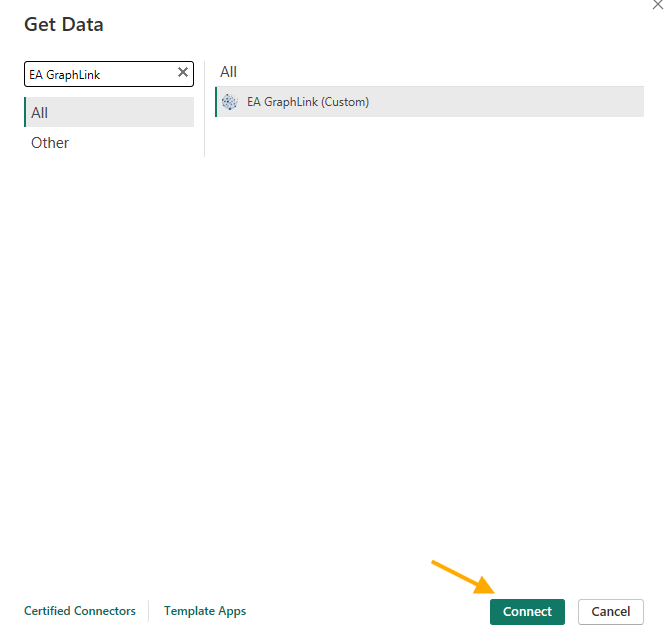
- Select EA GraphLink from the “All” section.
- After selecting EA GraphLink (Custom), Click the Connect button to proceed.
Enter Authentication Credentials
Upon Connecting, the system will prompt a third-party service dialog box from that Click on the “Continue” button for the dialog box.
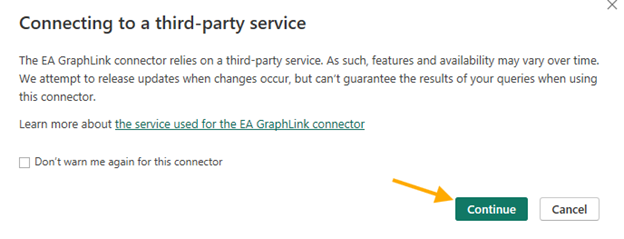
This will get into EA GraphLink Endpoint and API Token Fields.Checking the box “Don’t warn me again for this connector” will prevent the third-party services pop-up from appearing every time we connect.
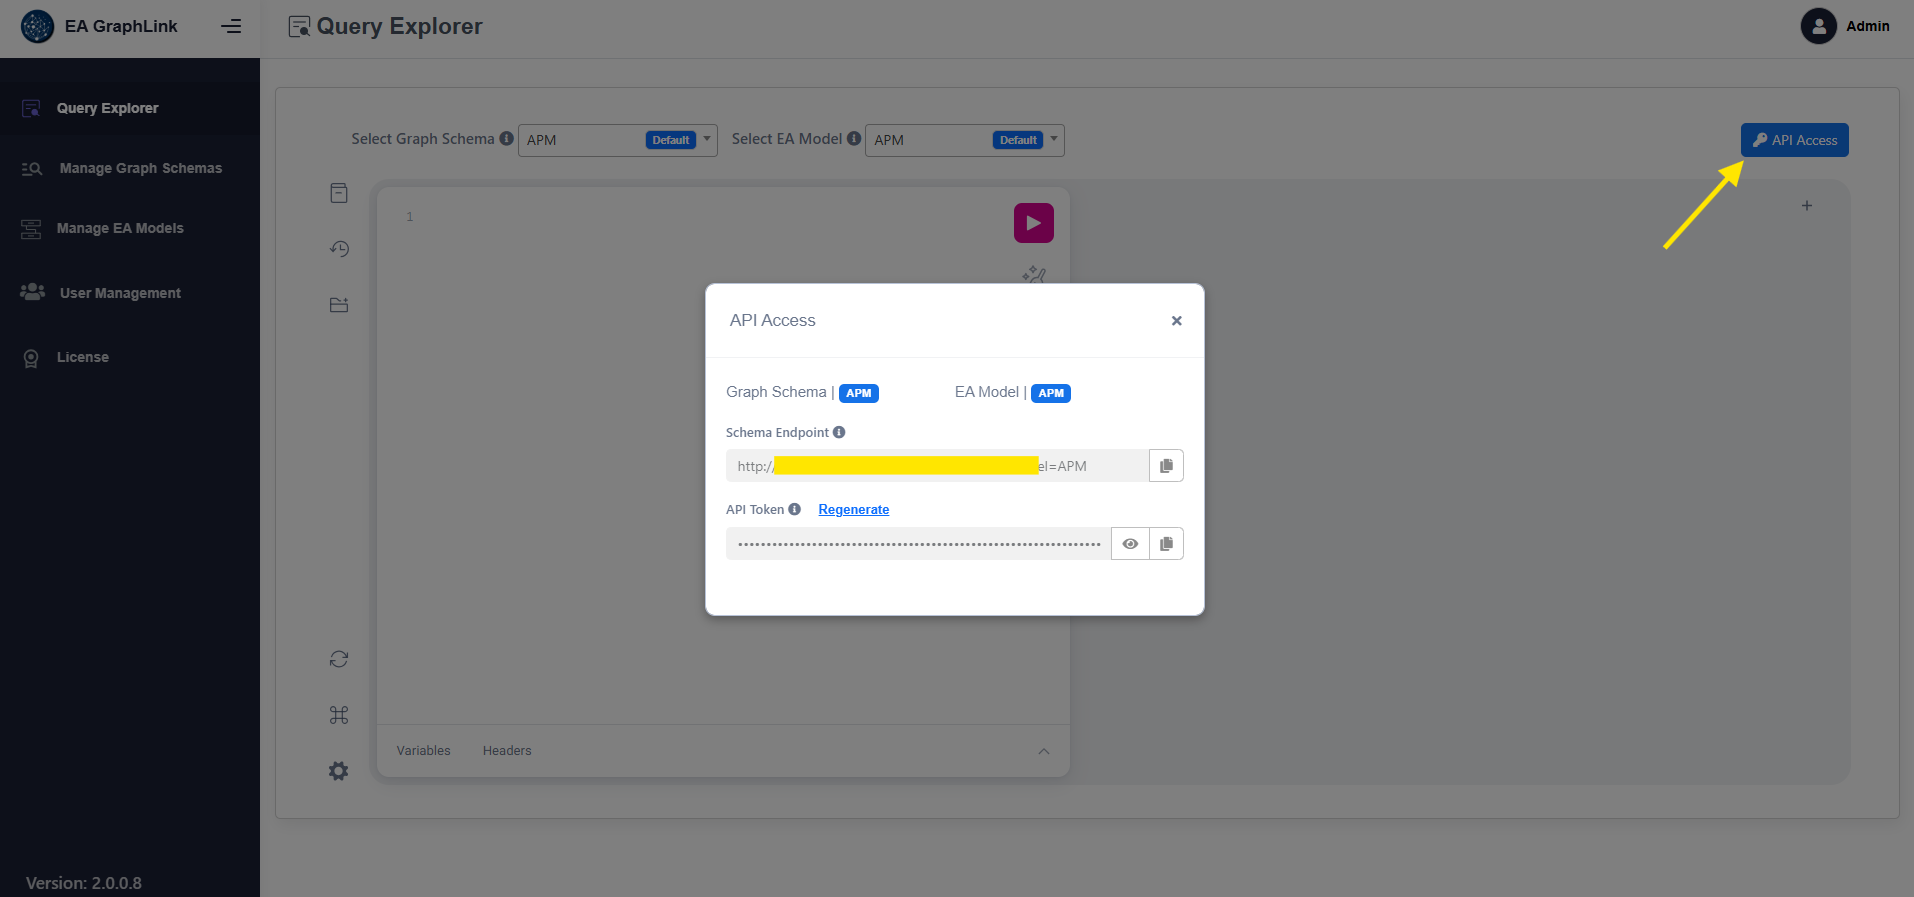
- These credentials can be retrieved from EA GraphLink under Manage API Access.
- Copy them using the icon as shown in the image below
Note: Before coping with them, ensure that the “Graph Schema” and “EA Model” are Selected correctly (The APM in the Graph Schema is configured, and the EA model is set to APM) Above the Endpoint and API Token.
- Paste the Endpoint and API Token copied from EA GraphLink into the respective fields.
- Click OK to complete the connection process.
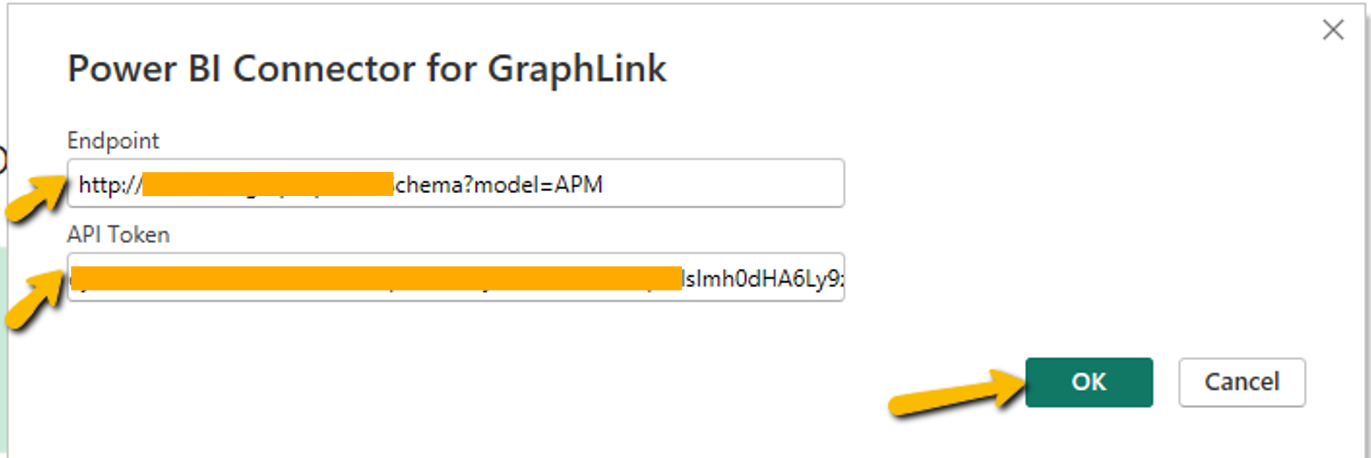
Note: This request may vary the second time we connect.

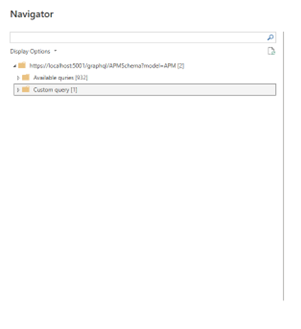
Upon successful configuration of the Endpoint and API Token, the application displays two folders: Available Queries and Custom Queries. These folders act as repositories for creating desired reports and charts.
Building Reports in Power BI
To create a report in Power BI, follow these steps:
- Configure the Data Source: Ensure the data source is set up as described in the previous section.
- Define the Dataset: Identify the dataset that will serve as input for the report. This process will be covered in the next section. The dataset can be created using two approaches: Available Queries and Custom Queries.
Select the Query Type – Choose the appropriate query type based on the reporting requirements.
Available Queries – These are auto-generated queries derived from the connected schema, incorporating default relationships to provide structured data for reporting.
Custom Queries – This approach is recommended when filtering data based on specific attributes or properties. Custom queries allow greater flexibility in defining data subsets tailored to specific analytical needs.
Building a Report using Available Queries
To select and load an available query
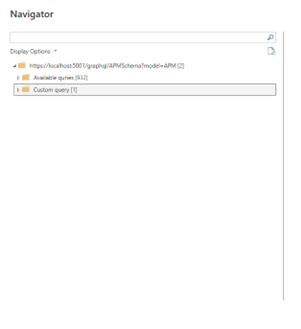
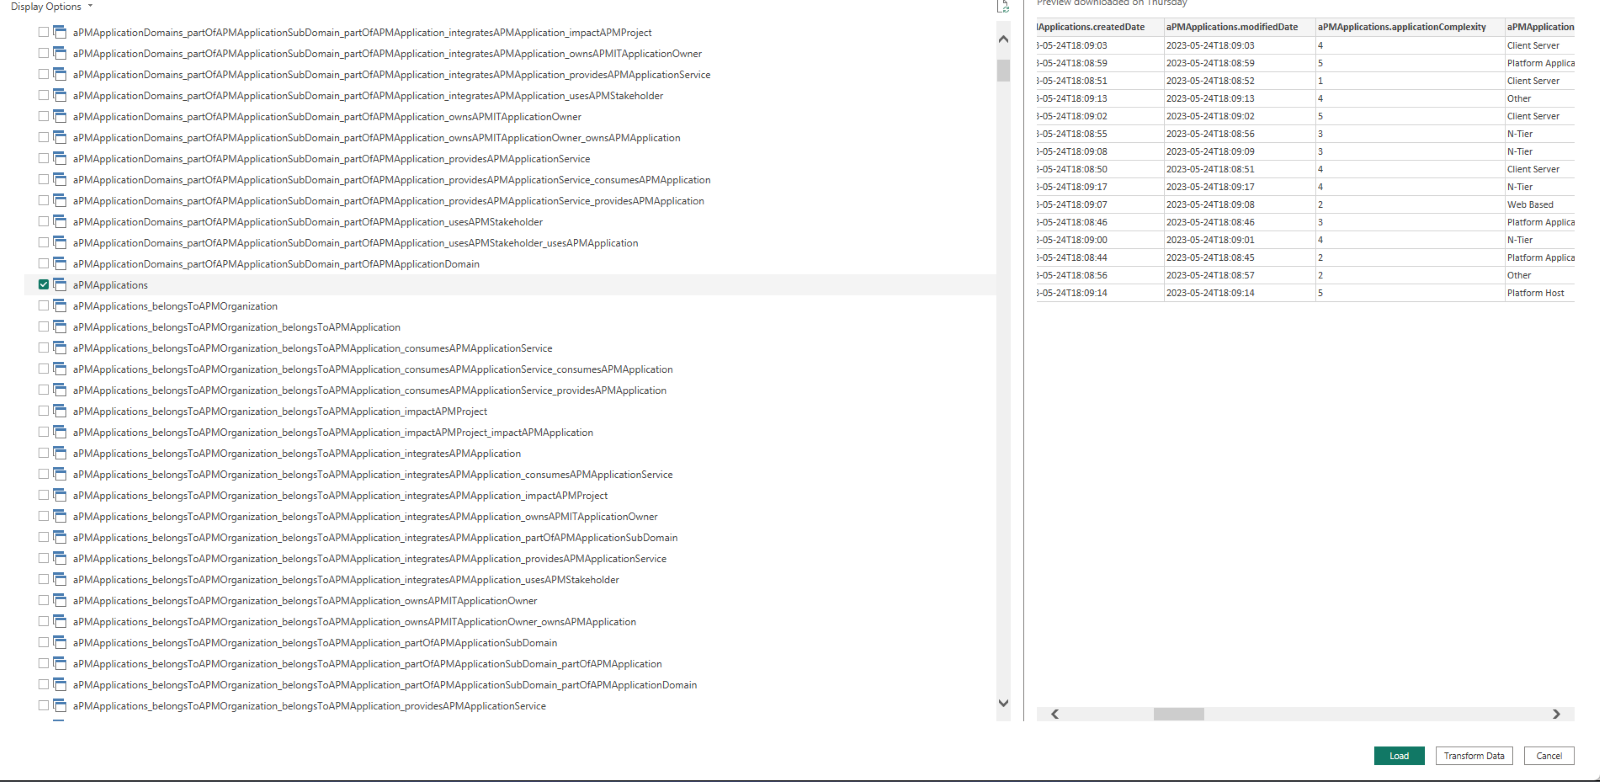
Clicking on Available Queries displays a list of queries based on the schema associated with the Endpoint. To create a dataset, select an option based on the specific use case.
For example, to build a report on applications and their properties without filtering any data records, select aPMapplication under Available Queries and click Transform Data for further modifications.
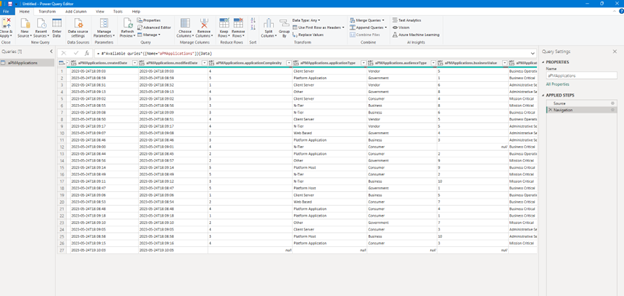
The Query Editor Window enables modification of column properties to generate charts, reports, roadmaps, and other visualisations. After applying the required changes, click Apply and Close (Top- Left Corner) to save updates.
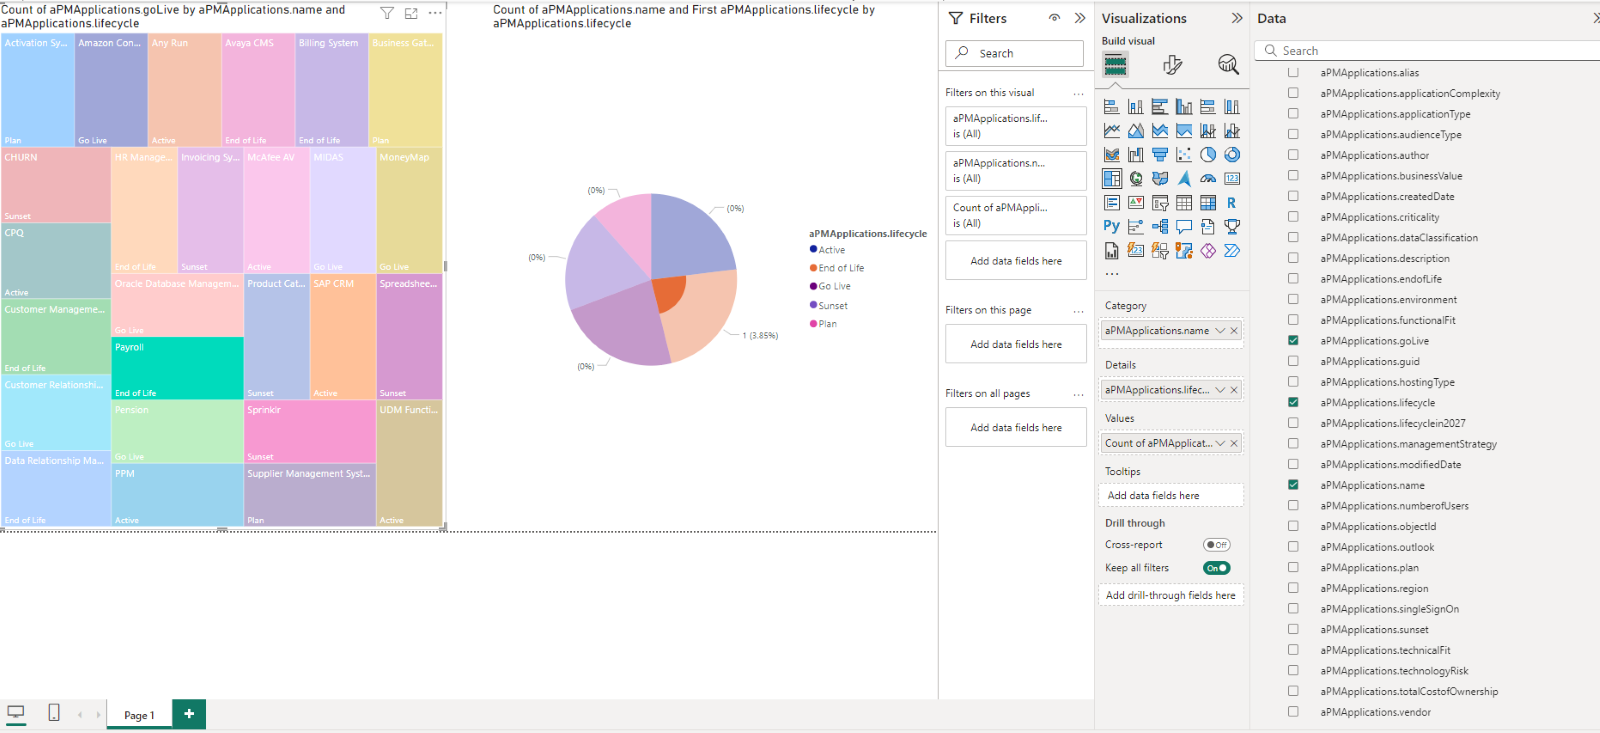
The system then navigates back to the Power BI Report Page, displaying the modified data on the left panel under the designated name.

Charts are generated based on the selected data, as illustrated in the image below.
Building a Report using Custom Queries
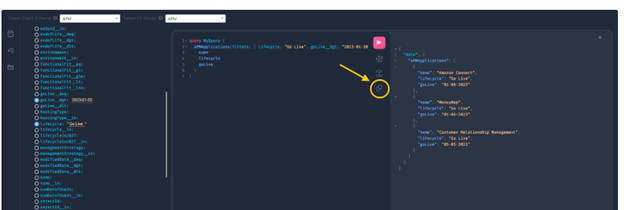
Custom queries enable advanced reporting by allowing data to be filtered and structured as input for reports. To create a custom query, build the query in EA GraphLink and copy it using the copy icon, as shown in the image below.
Executing a Custom Query in Power BI
- Open Power BI and ensure that the Endpoint and API Token are configured.
- Navigate to Custom Query under the generated folders.
- Enable the checkbox for Execute Custom Query.
- Paste the copied query into the GraphQuery tab located in the top-right corner.
- Click Apply to execute the query and display the results in the Execute Custom Query field. (Note: The window will not display the entire record)
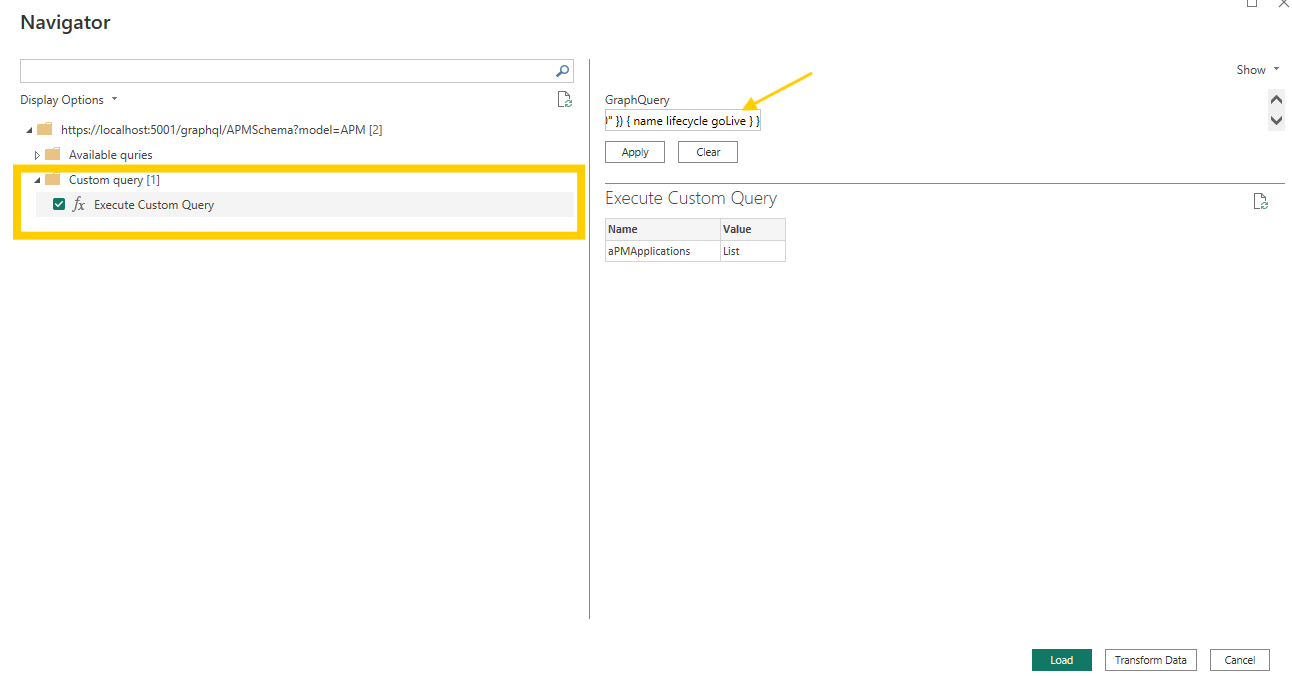
- Clicking Transform Data opens the Query Editor, allowing modifications to stereotype or property names for visualisation purposes.
- If no changes are required, select Close & Apply from the top-left corner to proceed.

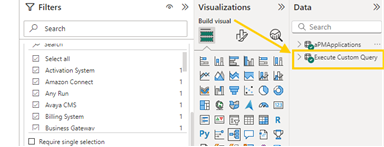
Once applied, the data is added to Power BI Reports, as shown in the image below. The retrieved data can be used to create various visualisations, charts, and dashboards with precision and clarity.
For any queries, contact the support team for assistance.
Limitation
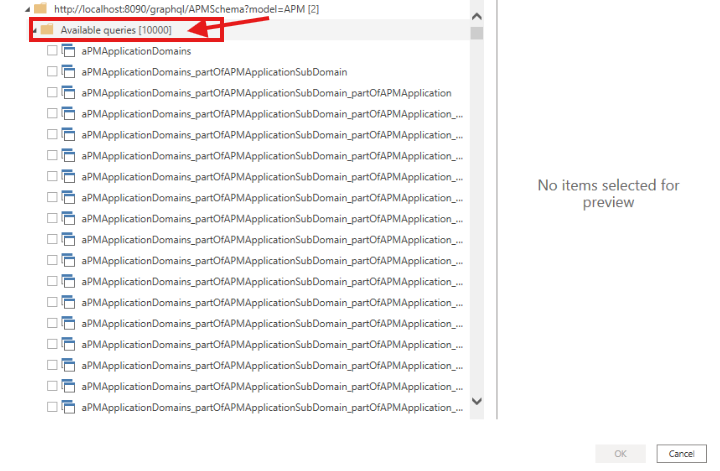
- The available queries are limited to 10.000. If more than 10.000 queries are generated, only the first 10.000 will be available, and any beyond that will not be listed.
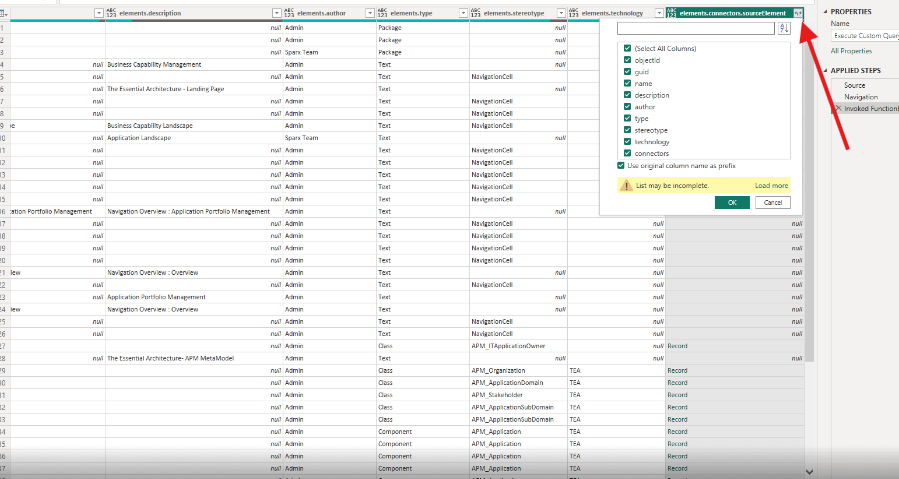
- Auto-expansion for custom queries in the generic view is limited to a set number of levels on table view. Further expansion must be done manually by transforming it, Expand the column using the icon shown in the image below.
